Infographic Charts and Graphics HTML Tags Library
Description
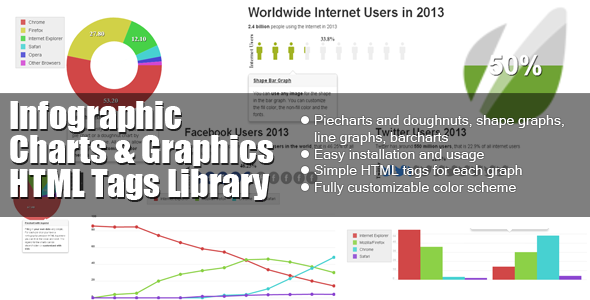
This custom JS charting library created by PSDDude from 0 implements custom HTML tags which allow creating charts and graphs for infographics.
It is a light-weight, pure JavaScript charting library (NO jQuery or other libraries required) which makes use of HTML5 technologies and works on all modern browsers including IE, Chrome, Firefox, Opera, Safari.
To use it you do not need to know any JavaScript, as all the charts are added as HTML tags. You can follow the very straight forward infographic library documentation which also contains examples.
The library allows creating: - Piecharts and doughnuts - Shape graphs – you can transform any image(PNG) into a graph - Shape bar graphs – use any image (PNG) to construct a bar chart - Line graphs - Barchart graphs
Extensive easy to use documentation included.
Easy customization: color scheme, size, etc.
BONUS: FREE WordPress Charts and Graphs plugin for adding infographics to your posts and pages. Did you know that you can manually insert HTML bar charts in your WordPress posts and pages?
Check out the infographic javascript library project page for planned features
Change log
v 1.0.6 Dec 30, 2018- fixed problem with legend display
- line chart can now display values for points. use point-text-* attributes to configure how the point values are displayed
- bar chart new attribute “max-value” – sets the maximum range of the grid; default is 0 which means that the actual maximum value of the data series determines the range of the grid;
- bar chart new attribute “bar-labels” can be true or false – determines whether to draw labels for each bar; default is false;
- for line charts you can specify individual point sizes through a new attribute on the “infographic-point” element named “point-size”; by default the “point-size” value of the “infographic-line” is taken into account
- for bar charts it is now possible to add marker images for each bar through the attribute “marker” set on the “infographic-bar” tag
- charts are now responsive; use % for width and the charts size will be adjusted according to the size of the element where inside which it is placed and it will also resize with the window;
- for piechart and doughnut charts added the attribute “start-angle” to indicate the starting point at which the slices will be drawn; this attribute is in degrees (from 0 to 360 but it can be any number even negative);
- for piechart and doughnut chart if only one slice value is used it will be treated as a percentage value; you can also use it as a value if the attribute “label-type” is set as “value” – set the newly added attribute “base-value” as a calculation base for displaying the chart (eg. if the slice value is 50, the “label-type” is set as “value” and the “base-value” is set to 200, the chart will display a slice 50 / 200 = 25%)
- for line graph added the “x-axis-labels” attribute to indicate if the graph should display labels on the X-axis
- bar graphs can now be configured to display as stacked bar graphs by setting the “bar-type” attribute to “stacked”
- for piechart/doughnut added the “padding” attribute to indicate the space between the outer circumference of the chart and the bounding box of the chart
- for piechart/doughnut added the “highlight-mode” attribute to indicate how to highlight slices on mouse-over; the highlight can be “default” for color highlight only, “pop” for highlighting by popping out the slice and “border” for highlighting by adding an exterior border around the slice
- for piechart/doughnut added the “highlight-size” attribute which works in conjunction with the “highlight-mode” attribute to indicate the size of the popping out effect for “pop” and the width of the border for “border” highlight mode
- added the “label-type” attribute to piechart/doughtnut which allows representing either percentage (“percent”), value (“value”) or hiding the slice label
- added the “label-decimals” attribute to piechart/doughnut for indicating the precision of the number displayed on each slice
- added the “label-unit” attribute to piechart/doughnut for indicating the name of the measure unit used on each slice (eg. millions, billions, pcs, etc.)
- added the “hole-size” attribute for doughnut charts to indicate the size of the center hole
- added support for displaying CSV data for the line graph (eg. you can export CSV data from GoogleAnalytics and use that file as a parameter for the graph and it will display it accordingly)
- line graph and bar graph has been adjusted to also support displaying of negative values
External listing. code.market does not sell this product and does not process payment for it. Pricing, payment, delivery, licensing, refunds, and support are handled by the third-party merchant on its own website. We may earn an affiliate commission from a referral. Details.
Products of the Week.
Submit#1

upvote.club
Free Social Media Engagement that Helps Boost Your Content. Upvote Club supports 19 social networks with 100+ engagement actions in one dashboard. Add links to your posts and get free engagement from real users.
SaaS · 15,736 views · 96 clicksSaaS · Week 42 · 15,736 views · 96 clicks
#2

Seenshot App
Free, Fast, MacOS Screenshot app. Make Screenshot cmd+shift+2 and send it via link
Desktop App · 4,790 views · 109 clicksDesktop App · Week 42 · 4,790 views · 109 clicks
#3

Conversational Backlinks for Busy Founders
Place Backlink Relevant Conversation for your domain across Forums and Conversations
Website · 16,617 views · 195 clicksWebsite · Week 42 · 16,617 views · 195 clicks
#4

Substack Posting API
Onboard your Agent to Substack. Write Publish on Substack via API
SaaS · 35,612 views · 184 clicksSaaS · Week 42 · 35,612 views · 184 clicks
#5

codester.com
SocialDesk+: Omnichannel Social Commerce & Business Management Platform This is stronger than simply “Social Commerce and Messaging” because it tells buyers this is a complete business platform, not just a messaging script. Turn Social Conversations Into Sales SocialDesk+ is a complete omnichannel social commerce and business management platform built for businesses that sell and communicate with customers through social media. Instead of switching between WhatsApp, Facebook, Instagram and TikTok, businesses can manage customer conversations, comments, products, leads, follow-ups, automation, teams and business reports from one professional workspace. And because the full source code is included, developers, agencies and entrepreneurs can customize, rebrand and launch SocialDesk+ as their own business solution or SaaS platform. 🚀 Build Your Own Social Commerce Business SocialDesk+ gives you the foundation to launch: - Your own SaaS platform - A white-label social CRM - A social-commerce management system - A customer communication platform - A business messaging solution - A custom solution for clients - A multi-business subscription platform 💬 Connect Your Customers Supported social channels include: WhatsApp • Facebook • Instagram • TikTok Bring supported conversations into one centralized workspace and help businesses respond faster without constantly switching between platforms. 🛍️ More Than a Messaging Platform SocialDesk+ combines communication with the tools businesses need to manage customer opportunities: Inbox Manage customer conversations from connected channels. Comments Monitor and respond to social-media comments. Customers & Leads Organize customer information and potential buyers. Products & Catalog Manage products and give your team quick access to product information. Follow-Ups Make sure potential customers don't get forgotten. Automation Automate repetitive customer questions and responses. AI Assistant Provide AI-assisted communication when configured. Team Management Give managers and staff access to the business workspace. Reports & Analytics Track activity using business reports and analytics. The current product listing already includes these capabilities. 🔥 Why Buyers Will Want It Launch Faster Start with an already-built business platform instead of developing the entire system from zero. Customize Everything The full source code is included, allowing developers to change branding, features, workflows and integrations. Build a SaaS Create multiple business workspaces and offer SocialDesk+ as a subscription-based service. Sell to Businesses Offer it to retailers, restaurants, service businesses, online sellers, agencies and other businesses that communicate with customers through social media. Mobile + Web + Backend This isn't just a mobile UI template. It includes: - Flutter mobile application - Python / FastAPI backend - Web interface - Administration tools - Database infrastructure - API-based architecture - SQLite / PostgreSQL support - Android and iOS project structure 💼 One Platform. Multiple Business Opportunities. For SaaS Entrepreneurs Launch your own subscription platform and allow multiple businesses to operate inside separate workspaces. For Software Agencies Customize and rebrand the platform for clients instead of building an omnichannel business system from scratch. For Developers Use the complete source code as a foundation for your own social-commerce or customer-management product. For Businesses Deploy a dedicated version for your own customer-service and social-commerce operations. 🧩 What's Included Mobile - Flutter / Dart - Android - iOS project Backend - Python - FastAPI - SQLAlchemy - Alembic Database - SQLite - PostgreSQL Web - HTML5 - CSS3 - JavaScript Deployment - Docker - Docker Compose - Production configuration Business Platform - Multi-workspace architecture - Authentication - Teams - Customers - Products - Messaging - Comments - Automation - Reports - Subscriptions - Administration The current listing also documents third-party integrations such as Meta, TikTok, Stripe, Firebase, SMTP and optional OpenAI configuration. ⚡ What Makes SocialDesk+ Different? You're not buying a simple: ❌ Chat UI ❌ WhatsApp clone ❌ Flutter template ❌ Admin dashboard ❌ Basic CRM You're getting a complete business platform foundation that can be customized, branded and commercialized. Connect. Automate. Manage. Grow. SocialDesk+ Omnichannel Social Commerce & Business Management Platform One important change I'd make to the current listing The current page starts with: “A simple guide to managing your social conversations, customers, products and business activity.”
Other · 3,023 views · 30 clicksOther · Week 42 · 3,023 views · 30 clicks
#6

sandbook.app
Sandbook reads EPUB, PDF, web pages and scanned pages aloud with Kokoro TTS, an open neural voice model that runs on your iPhone, free and offline. Choose from 41 natural voices in English, Spanish, French, Italian, Brazilian Portuguese and Hindi and follow each word as it is spoken. Try the same voices in your browser first with the free Kokoro TTS online demo.
Other · 3,029 views · 13 clicksOther · Week 42 · 3,029 views · 13 clicks